A New Examination of 08/08/1972 Loch Ness Sonar Chart
Finds No Trace of
a Monster
Dick Raynor, Inverness, Scotland.
ABSTRACT: During underwater
investigations at Loch Ness in August 1972 a chart-recording sonar machine recorded
traces presented as indicating the presence of a large unknown animal, presumed
to be the Loch Ness monster. This study correlates the recorded traces with the
objects known to be within range of the equipment used and finds no evidence of
anything remarkable on the paper record.
INTRODUCTION
On the night of August 7th-8th 1972 a group of investigators from the
Academy of Applied Science and the Loch Ness Investigation Bureau had deployed
sonar and underwater lapse-time camera equipment below two boats, Narwhal
and Nan, moored in Urquhart Bay, Loch Ness.
Between approximately 0100hrs and 0210 hrs the sonar equipment recorded
unexpected traces. When the underwater camera film was later processed it was
found to contain three frames showing a disturbance, said to have been exposed during
the same period as the unexpected traces. The sonar trace was shown to various
experts who made comments supportive of the idea that the trace was caused by a
large unknown object, presumably an animal. Those comments were then used to
support the suggestion that the objects in the underwater photographs were the
same as those on the sonar trace, and represented part of a large unknown
animal swimming in Loch Ness.
This paper correlates the sonar chart recordings
with known objects in the water by means of contemporary accounts by the
investigators themselves and an aerial photograph of the same area taken some
seven months later. Once all known objects are accounted for in the sonar
recording there are no residual traces requiring explanation.
METHOD
A close examination of the sonar chart recording used in the November 1972
media releases (Fig1), together with the more complete record published in the
International Wildlife Magazine Volume 18 Number 3 March 1976, (Fig 2) show
repeated similar patterns of four lines, the first two being equally thin and the
second two being equally thick, over a period of one hour. These are
highlighted in Fig 3.
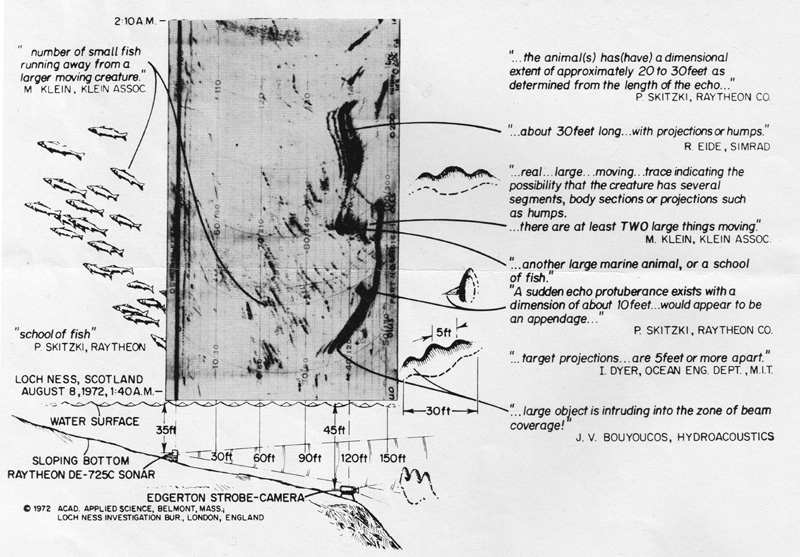
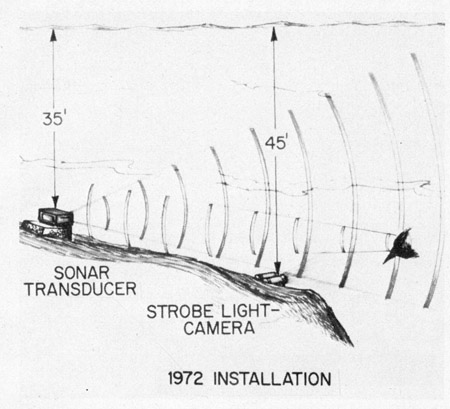
Fig 1. "AAS sonar chart 8th August 1972" as explained in contemporary
press release.
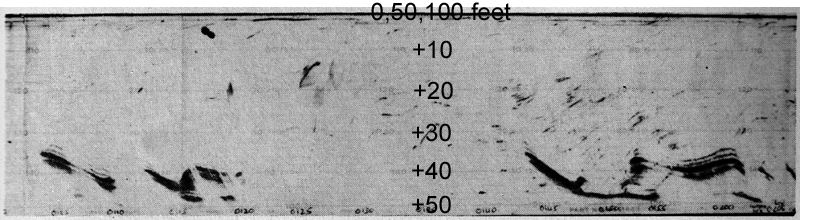
Fig 2. Complete chart record between 0100 hrs and 0210 hrs
with over-printed scale markings at centre.
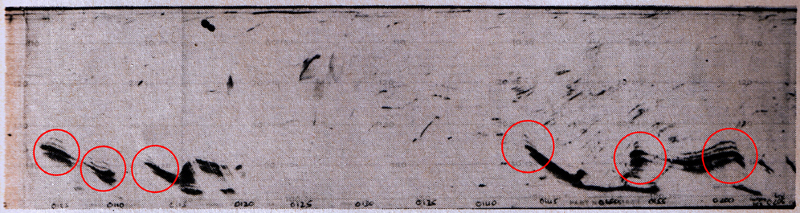
Fig 3. Complete chart record showing repeated traces of two thin lines and
two thick lines.
There is an important error in Fig 1. circulated by the Academy of Applied
Science, as it shows both sonar transducer and camera / strobe unit deployed in
a stationary mode on the bottom of the loch. Had the equipment been deployed in
this way then all static objects would appear as horizontal lines on the chart
paper. On the night in question, the equipment was suspended beneath two moored
boats, free to move around independently under the influence of wind and
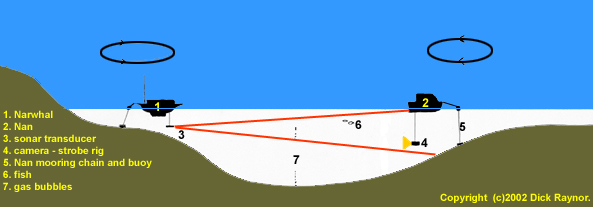
current. This layout is shown in Fig 4, below. The author asserts this to
be the case as he was one of the crew on the sonar boat Narwhal on the evening
in question, though not at the time of the sonar contact under discussion.
Fig 4. "Arrangement of boats on 8th August 1972" - Raynor
version.
This means that the camera equipment could sometimes be within the area
covered by the sonar beam, and sometimes outside it, and the distance between
the sonar transducer and the camera unit could vary by a distance in the order
of ten feet as the boats moved around. An example of the movement of a moored
yacht in the same vicinity is shown in Video 1. below.
Fig 3 shows the way the camera unit (and perhaps its associated surface boat
and mooring system) change their separation by about 5 feet over a period of
about 5 minutes. The "down" direction on the chart in Fig 3 is "further away"
from the sonar transducer, while the horizontal axis along the chart from left
to right is Time, as shown by the hand written numbers along the bottom of the
chart. The 4-line trace from the camera / boat / mooring system stays
essentially the same in character, only changing in distance from the sonar
transducer at the top of the chart.
How this particular sonar works
Sonar is a method of measuring the distance to
something underwater by sending out a short pulse of sound and measuring the
time it takes for an echo to return. The chart recorder machine common
until the mid-1980's used special paper which conducts electricity. A metal wire
called a stylus on a belt or rotating disk travels across the paper from
top to bottom several times per second and every time it passes the top of the
paper a pulse of sound is transmitted into the water from an underwater sound
emitter called a transducer. This same transducer also receives echoes from
objects underwater and these weak electrical signals are amplified and fed to
the stylus which then burns a mark on the paper.
The further away the reflecting object is, the longer
it takes for the echo to return and the further down the chart the mark is made.
In the chart shown there is a "transmission mark" along the top of the paper at
zero distance, and a number of other marks lower down marking echoes from other
objects at varying distances.
In most chart recording sonars, also called
fathometers, the user can change the "range" of the machine to suit the
conditions by altering the speed of the stylus over the paper. The Raytheon
DE-725C used in this operation had a choice of two speeds of rotation - a
high speed for short ranges up to 150 feet and a 3 times lower speed for longer
ranges.
In commercial machines the paper chart is often 10
inches or 250 mm wide, allowing fine detail to be shown, while in machines aimed
at the recreational market it was usually much smaller, around 4 inches or 100
mm. This smaller paper usually gave lower resolution of detail but in the case
of the DE-725C an ingenious modification was introduced. Instead of one wire
stylus carrying the signal to the paper there were three of them spaced 120
degrees apart on the rotating disc. The advantage of this is that the disc could
spin at a high speed giving good resolution while the three styli effectively
tripled the width of the chart paper. The drawback was, however, that the three
simultaneous ranges being recorded were indistinguishable from each other. In
normal use, pointing downwards, with a boat leaving the shore, the user would be
aware of the increasing depth being shown and as the water depth passed the 50
foot mark the first stylus would stop recording on the bottom of the chart and
the second stylus would start recording at the top. The paper has faint lines
printed on it running along the roll, and every few inches there is a transverse
line with numbers at the principal depths. One set reads 10/30, 20/60,
30/90, 40/120 and 50/150, the next reads 60/180, 70/210, 80/240, 90/270 and
100/300, while the last reads 110, 120, 130, 140, 150. When the water depth
exceeded 150 feet the user would change to the 300 foot range which effectively
slowed down the rotating stylus carrier to 1/3 speed. This is satisfactory
when the equipment is used in the normal downwards-pointing mode to measure the
depth of the water, but when the transducer is mounted horizontally as on this
occasion there is no
indication as to which of the three short range values or two long range ones is
the correct one. They are simply recorded on top of each other.
As an example, look at the top image where a dense
trace with about four separate components is labelled "about 30 feet long...with
projections or humps". The explanatory diagram beneath the photo of the trace
shows the object to be at about 120 feet range, but it could equally have been
at 40 feet, or 80 feet, or 120 feet, or a combined trace of separate objects at
all three distances. There is no way of knowing.
Let us now go back and look again at the trace
labelled "about 30 feet long". It consists of, from the top, two weak lines, one
well-defined thicker line and another softer but equally thick line. This
is what sonar operators call a "signature" - the kind of echo returned by an
object of specific composition. From top to bottom on the chart this signature
seems to be about 5 feet in extent, so the first weak line is an echo from
something about 5 feet closer to the sonar transducer than the second soft thick line.
This "signature" can be found at six points on the chart, spread over a
period of one hour. It is always in the same general part of the chart, range
about 35 to 40 feet, or 85 to 90 feet, or 135 to 140 feet, as discussed earlier
no-one can be sure. I will accept for the present that it was really at 135 to
140 feet range, where the camera rig was suspended from the motor cruiser called
"Nan".
The sonar beam.
A sonar pulse can be likened to a torch or flashlight
beam in that it gets wider and weaker as it gets further away from its source.
The transducer used on this occasion has a nominal beam width of 20 degrees,
meaning that 10 degrees away from the centre line it has only half the power
that it has in the centre. So at a distance of 140 feet this beam - a "cone of
sound" - is 50 feet in diameter. What should appear on the trace if it is
pointing towards an anchored boat with a camera rig suspended underneath its
stern?
The equipment arrangement.
There is some historical confusion here from the
start. The deployment of the equipment according to the AAS explanatory
diagram (Figs 1 and 4) shows the sonar standing on the bottom of the loch and
the Edgerton Strobe unit also on the bottom of the loch some distance away and
deeper down. With this arrangement all static objects in the beam will appear as
constant parallel lines. On the night in question, the camera was on one boat
and the sonar was on another, both of which were free to swing on their moorings
as shown in Fig 3. A viewing of the 60 minute lapse-time video of an anchored
yacht close to the old Narwhal mooring shows that boats swing around many tens
of degrees and move back and forth several metres, so any fixed objects within
range of the sonar could be intermittently in an out of the beam and at slightly
different ranges. Echoes associated with another independently moving vessel
within range would be even more erratic and the region near the camera unit
would only be within the sonar beam intermittently.
Video 1."Lapse time video of anchored yacht close to Narwhal
location" Copyright Dick Raynor 2012 Right-click on the image, then select "play"
Fig 3. "Arrangement of boats on 8th August 1972" - Raynor
version.
Fig 4. Arrangement of boats (i.e. no
boats) on 8th August 1972
as presented by AAS, leading to erroneous conclusions by consultees.
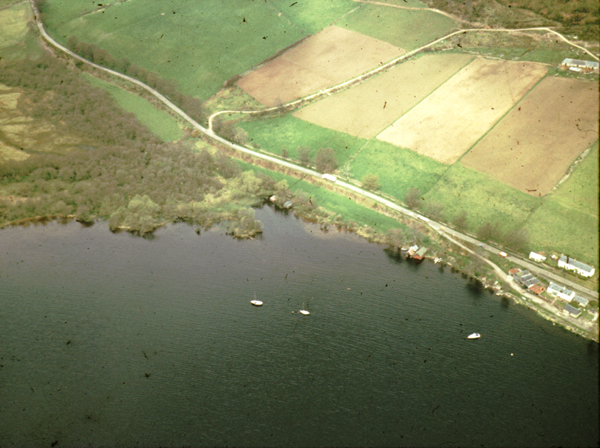
Fig 5. Aerial view of moorings near
Temple Pier taken early 1973. Photo Copyright (c) Holly Arnold
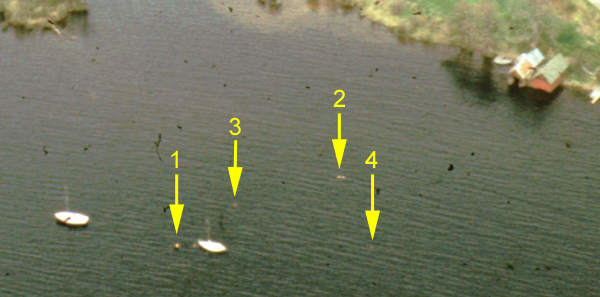
Fig 5a. Enlarged print shows Camera boat
"Nan" mooring buoy 1, Sonar boat "Narwhal" mooring buoys 2, and two other red
mooring buoys 3 and 4.
Measurements of red boat shed made in
September 2013 to permit independent analysis are: width of red frontage -
4.62m , 15'2"; total height to roof ridge - 4.97m, 16'4"; width under eaves
5.46m, 17'11"; total length of roof ridge 10.2m, 33'6". (See
amended measurements below)
My provisional
measurements indicate that the presumed Narwhal mooring buoys (2) are 39.3
metres or 129 feet away from the Nan mooring buoy (1), agreeing well with the
sonar trace. Note also the way that the moored yachts are lying to the current,
and not to the breeze which is on their port sides. The red buoy (3) is measured
at 79 feet from the sonar boat buoys (2)
The sonar trace.
So what should be visible on a sonar trace when the
beam is swinging around but pointing generally towards the camera unit?
Well, the camera and strobe units should be there
unless obscured by a closer object, and being air-filled glass-fibre cylinders
they will give a very strong echo. The submerged part of the boat hull could
also appear, and the heavy chain from the mooring buoy will go down to the
bottom only a few metres from the boat. These would appear as a series of echoes
of a fairly constant nature. The existence of buoys 3 and 4 in early 1973
strongly suggests that they were present in August 1972. If so, they and their
mooring chains would both be detectable by the sonar as it swung from side to
side under with "Narwhal" rotation around buoys 2. Buoy 3 is of particular interest as
it seems to be 79 feet from the sonar boat mooring and within 20 degrees of the camera boat "Nan" as viewed from
"Narwhal" and so could have been detected just before or after the camera rig
and the vessels swung around.
Most significantly, these marks do not appear on the chart at the same
time as the "main" echoes, but shortly before or after them, suggesting that
it may have been on a slightly different bearing.
Conclusion.
Given the mobile nature of both sonar equipment and
camera equipment there is no reason to expect consistent traces. The vessels
employed responded differently to currents and changing breezes. Such traces as
were recorded, in particular the quadruple marks appearing about six times in a
period of one hour, are what one would expect from highly reflective camera
containers, mooring chains and boat hulls. Even the unusual trace at 0147 hrs,
interpreted as an echo protuberance with a dimension of about 10 feet, has a
precedent at 0115 hrs. The size of the camera tubes was approximately 8" / 20 cm
diameter and 24" / 600 mm long and one could reasonably expect them to give very
strong echoes. If an animal with 6 to 8 foot long flippers ( and presumably a
body over 20 feet long) swam within a few feet of the camera tubes it would
inevitably have presented a massive sonar trace for just two or three minutes
before swimming away, and there is no evidence from the sonar of that having
happened. My conclusion is therefore that the sonar chart shows intermittent
echoes from the camera equipment suspended beneath the other vessel, and nearby
mooring lines.
This version of 2013-10-04 includes measurements of
the red boatshed to permit independent photogrammetry.
Update below on 2013-10-06 includes front view
photograph of boatsheds and more accurate measurements made with Leica Disto 2.
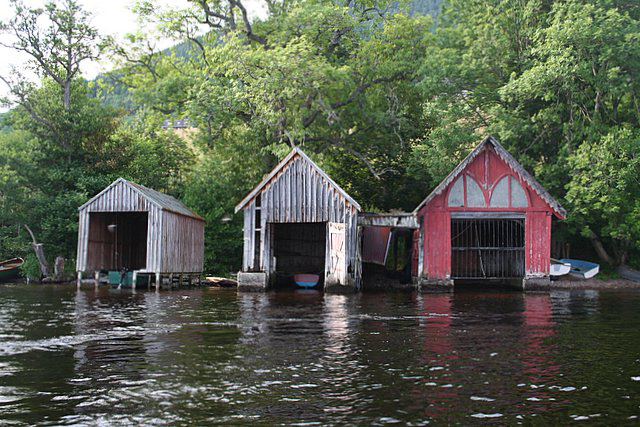
Boat Houses in Urquhart Bay by Des Colhoun, from
geograph.org.uk. Looking north.
The boat house has wooden walls painted red which
stand on an asymmetrical concrete base which is wider on the left (west) side.
The eaves overhand the walls at both sides and each end. The left edge of the
eaves is hidden in this photograph. The width of the red frontage is 4.87 m, the
total length of the roof is 10.24 m and the total width of the roof is 5.48 m.
